


With the Windows 10 October 2018 update release, Microsoft had quietly added a built-in command-line network packet sniffer called Pktmon to Windows 10. Since then, Microsoft has added a few more features to the tool that make it much easier to use.
A packet monitor, or network sniffer, is a program that lets you monitor the network traffic flowing over a computer’s network devices down to the individual packet level.
When Pktmon was first released as part of the October 2018 Update, it only supported the event trace log (ETL) format, a proprietary log format created by Microsoft. Since then, Microsoft added PCAPNG log file support and real-time monitoring, which is demonstrated in this article.
To use Pktmon, you need to launch a Windows 10 elevated command prompt as the program requires administrator privileges. You can then get instructions on using the program by typing pktmon help in the command prompt.
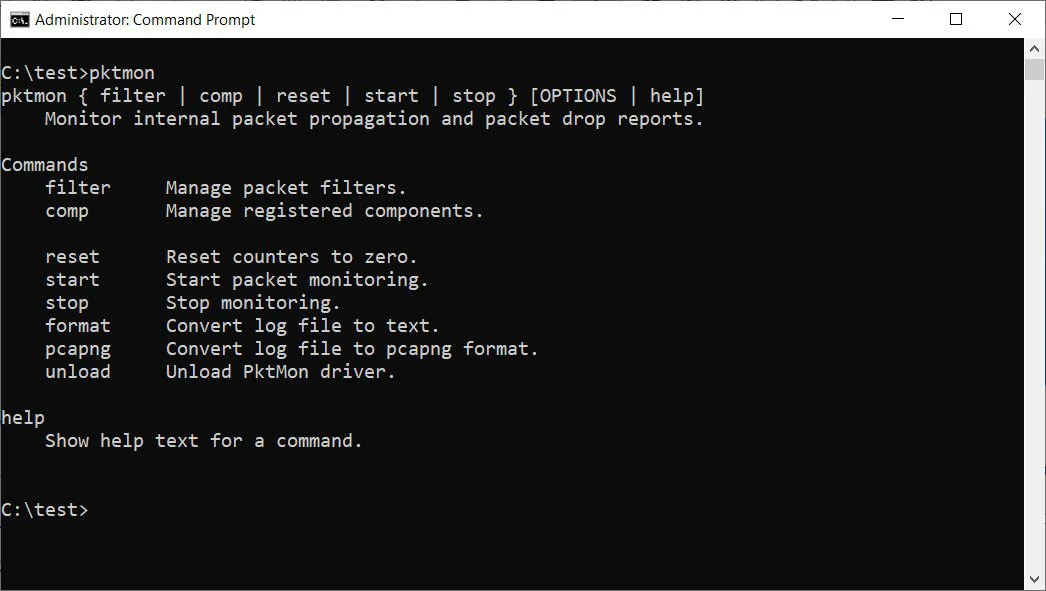
To get further help instructions about a particular command, you can type pktmon [command] help. For example, to see the documentation on the ‘comp’ command, you would type pktmon comp help.
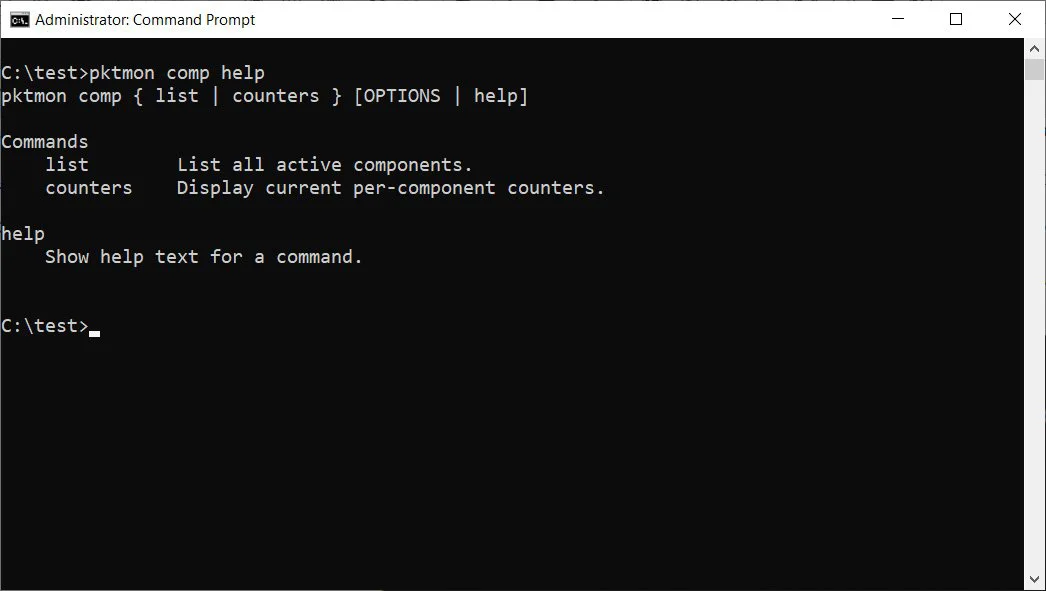
For each subcommand, you can continue using the help function to see its instructions – for example, pktmon comp list help.
Using the built-in help feature is a great way to learn how to use Pktmon, and it’s recommended that all users explore the documentation before trying to use the program.
Also Read: Trusted Data Sharing Framework IMDA Announced In Singapore
Compared to a network monitor with a graphical user interface, the command-line interface of Pktmon takes a bit more time to get used to it.
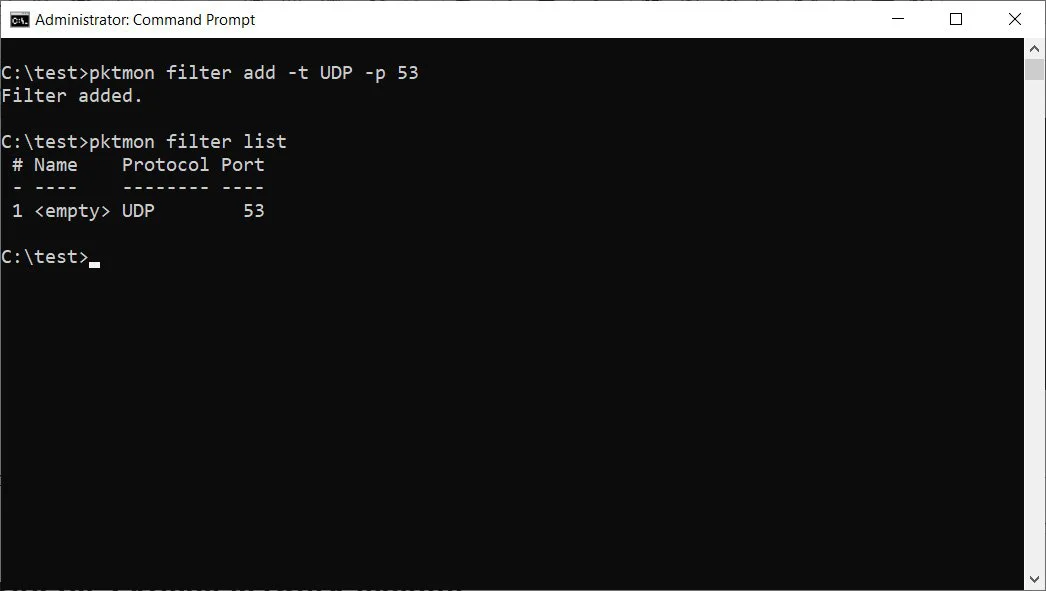
Before you can monitor packets, you first need to create filters using the pktmon filter add command, which specifies what traffic you want to monitor.
For example, you can monitor all the network traffic on your network using the pktmon filter add -i 192.168.1.0/24 command or monitor DNS traffic using pktmon filter add -t UDP -p 53. Once again, it is strongly recommended to review the pktmon filter add help documentation to learn how to make filters.
For our demonstration, I have created a filter to monitor DNS traffic as described above. To see the filters made to monitor traffic, you would enter the pktmon filter list command.
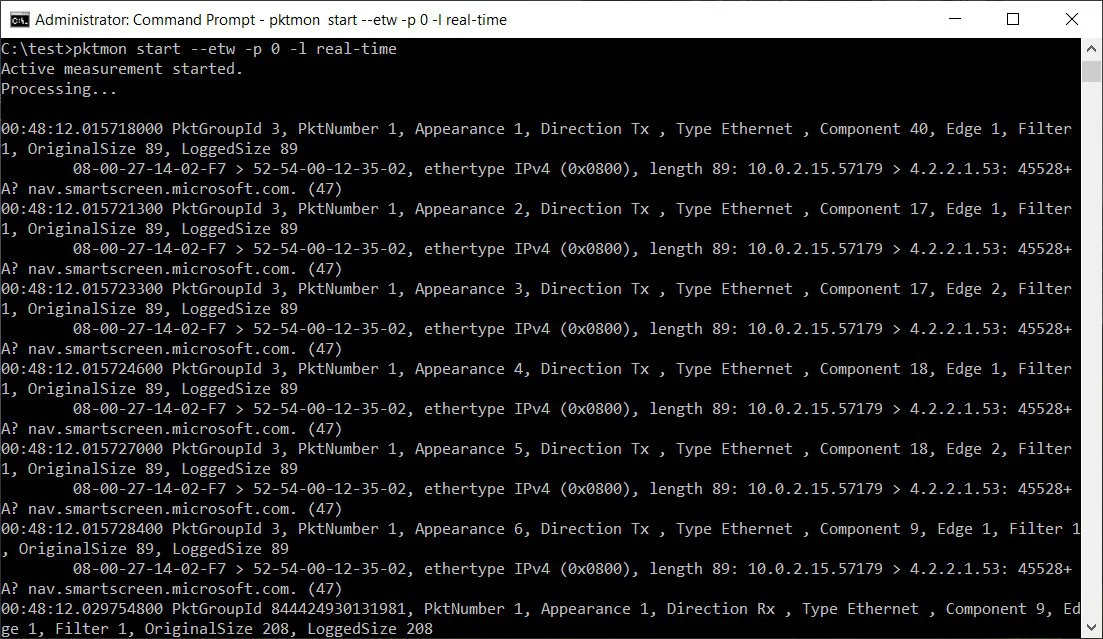
To start monitoring for DNS traffic on all network interfaces and display the activity in real-time, you will use the following command:
pktmon start --etw -p 0 -l real-timeIt should be noted that I used the -p 0 argument, so it captures the entire packet. You can also specify the specific network interface to monitor using the -c argument followed by an interface index ID. For a list of network interfaces and their index IDs (ifIndex), you can use the pktmon comp list command.
Once you start monitoring traffic, you will see captured DNS packets displayed in real-time in the command prompt, as shown below.
When you are ready to stop monitoring traffic, press the Ctrl-C keyboard combination. When done, there will be a PktMon.etl log file created in the folder you ran Pktmon.
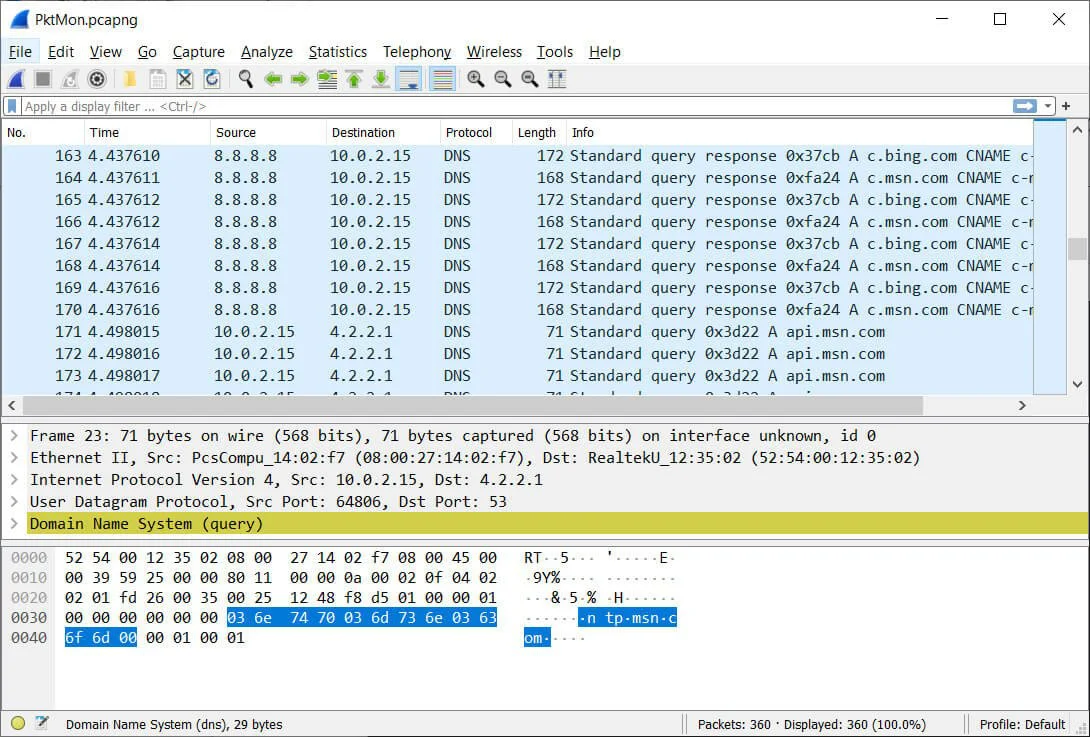
Unfortunately, ETL files are not a very good option as many applications do not support them. Instead, it would be best to convert it to a PCAPNG file using the pktmon pcapng command. For example, to convert the PktMon.etl to a PCAPNG file called PktMon.pcapng, we would enter the following command:
pktmon pcapng PktMon.etl -o PktMon.pcapngOnce the log file is converted into the PCANPNG format, you can load it into a program like Wireshark to get detailed information about each DNS request.
Also Read: Data Protection Authority GDPR: Everything You Need To Know
As you can see, Pktmon is an extremely powerful tool that allows you to get a great insight into the type of traffic running over your network.
At the same time, Pktmon can be complicated to use, so it is strongly advised that users familiarize themselves with the help documentation before using it.
